- The paper introduces a novel TWG framework that transforms GPS data into spatio-temporal graphs to reveal key strategic zones.
- Using spatial grid mapping, the framework models player movements and connectivity across dynamic field zones.
- Graph analytics methods such as betweenness centrality and community detection provide actionable insights for optimizing team tactics.
A Framework for Spatio-Temporal Graph Analytics in Field Sports
The study "A Framework for Spatio-Temporal Graph Analytics In Field Sports" introduces an innovative graph-based methodology for analyzing the dynamics of team sports through GPS tracking data, with a focus on Gaelic Football (GF). This paper presents a novel framework for constructing Time-Window Spatial Activity Graphs (TWGs) which aids in understanding both individual and team-based movement during match play.
Introduction
Spatio-temporal data in sports analytics has emerged as a crucial component for understanding dynamic game elements by integrating both geographical and time-based data dimensions. The proliferation of GPS technology in field sports has provided a wealth of detailed data on player performance. Yet, traditional analyses predominantly emphasize individual metrics such as distance covered or external load, often neglecting the complexities of team dynamics. The research introduces a method to address this gap by mapping player movements via TWGs to gain novel insights into team dynamics and player interactions. This is achieved through dividing the playing field into a spatial grid and analyzing the connectivity and temporal behaviors across these grids.
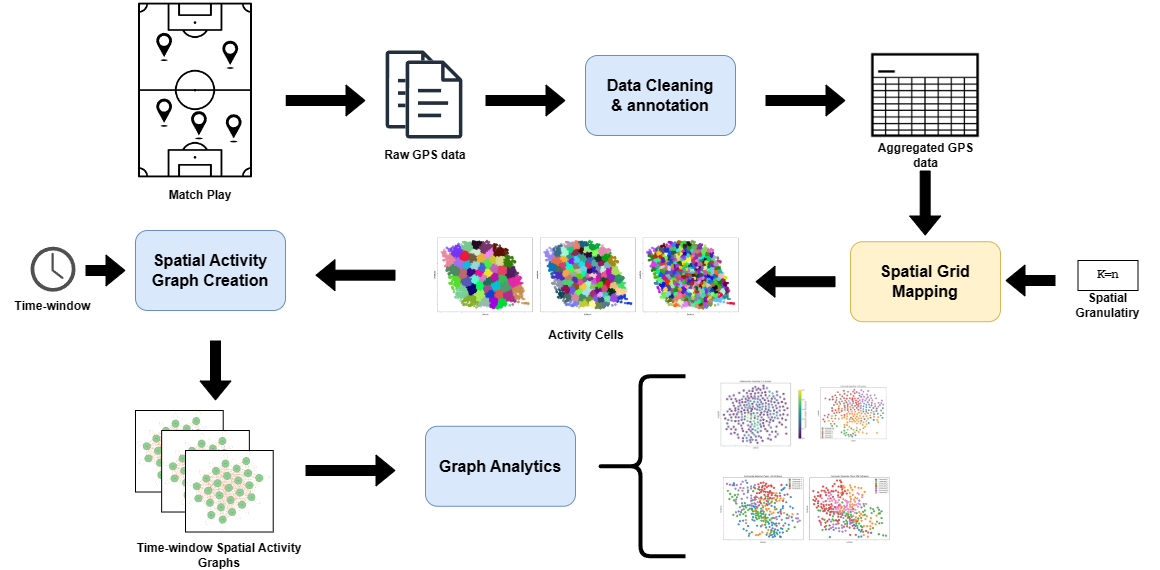
Figure 1: Overview of framework for spatio-temporal graph construction.
Methodology
Data Processing
The research leverages a dataset derived from raw GPS recordings during Gaelic Football matches using 10Hz GPS sensors. These devices capture latitude, longitude, and speed data at a high frequency, which are cleaned and annotated to generate comprehensive datasets that encapsulate player actions. Each dataset entry includes information such as coordinates, speed, and duration of actions (Table 1).
Spatial Grid Mapping
The pitch is segmented into a dynamic spatial grid using the Tesspy library, transforming the field into non-overlapping, grid-based subspaces. Each player's coordinates are mapped onto these grid centroids, facilitating the construction of spatial activity graphs by assigning connectivity between these spatial zones.
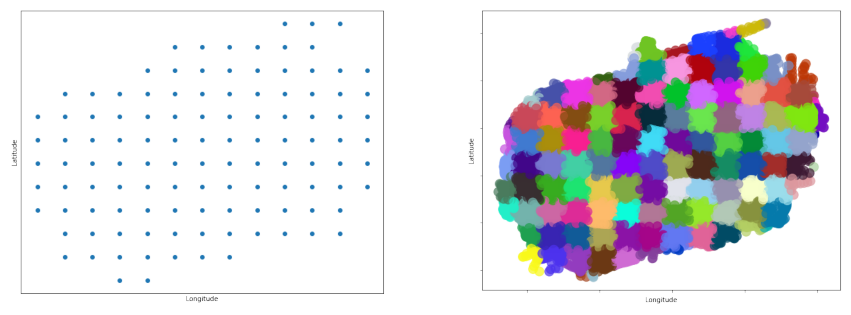
Figure 2: Spatial grid mapping of the pitch. Left: grid points returned by the library. Right: result of associating players' coordinates to the closest grid point.
Spatio-Temporal Graph Construction
Through a rolling window approach, the TWGs are constructed to capture dynamic spatial activity over specified time intervals. Nodes represent areas covered by players, while edges signify movements between these areas, weighted by parameters like average speed.
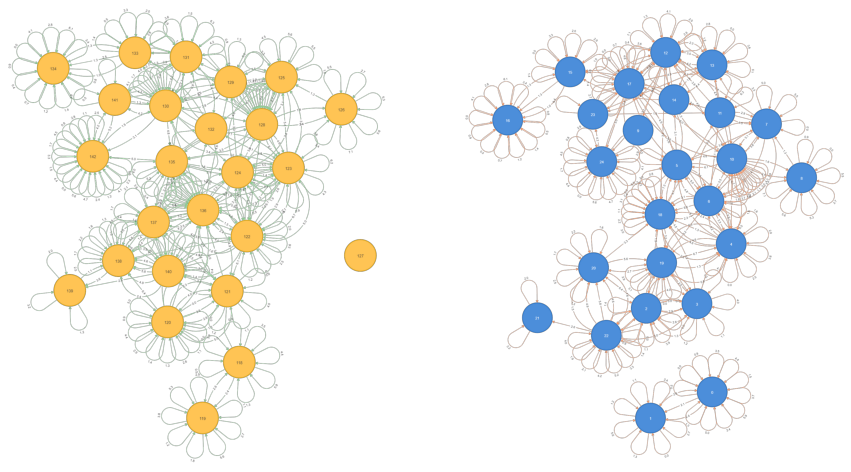
Figure 3: Sample of 25 nodes of the TWG for time windows: [0,5) (left) and [1,6) (right) in a selected game before edges aggregation.
Graph-Based Analysis
Graph analytic techniques such as betweenness centrality and community detection are employed on the TWGs. Betweenness centrality identifies critical areas frequently traversed, highlighting strategic zones for player transitions, while community detection reveals clusters of interconnected regions, thus mapping team strategy and positioning.
Results and Analysis
A detailed case study with Gaelic Football match data demonstrates the framework’s efficacy. The analysis revealed varying topologies for each TWG, reflective of the game's dynamism. Betweenness centrality scores identified strategic key areas, typically centered within the pitch, where significant speed variability was noted. This suggests their influential role in transitioning player movements and strategy evolution over time (Figure 4).
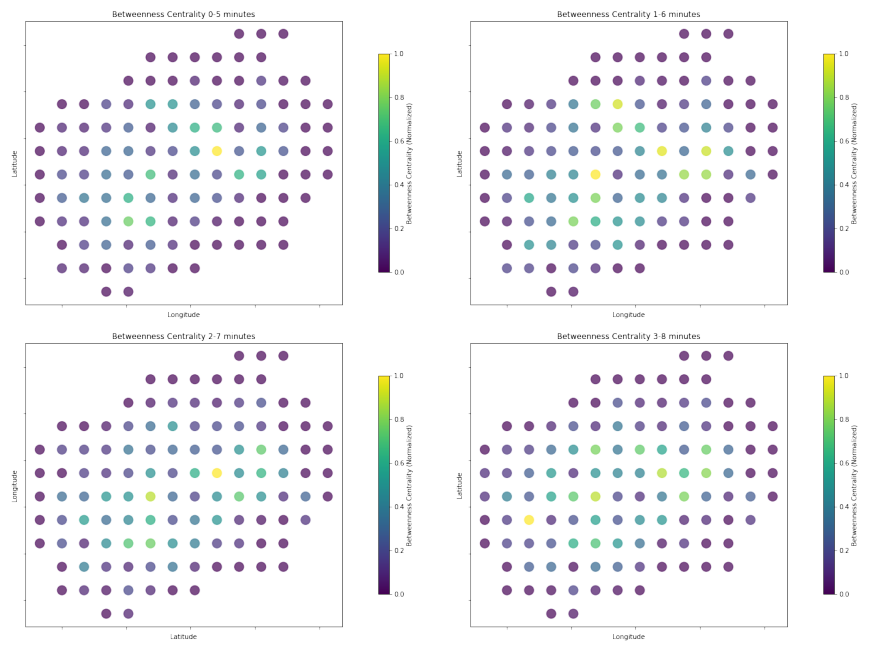
Figure 4: Betweenees centrality for 5 minutes rolling windows in four segments, indicating high-activity areas.
Community detection captured temporal shifts and merging of connected field zones, indicative of changes in the team’s spatial dynamics and collective interactions. These observations provide valuable insights for optimizing player tactics and strategic decisions (Figure 5).
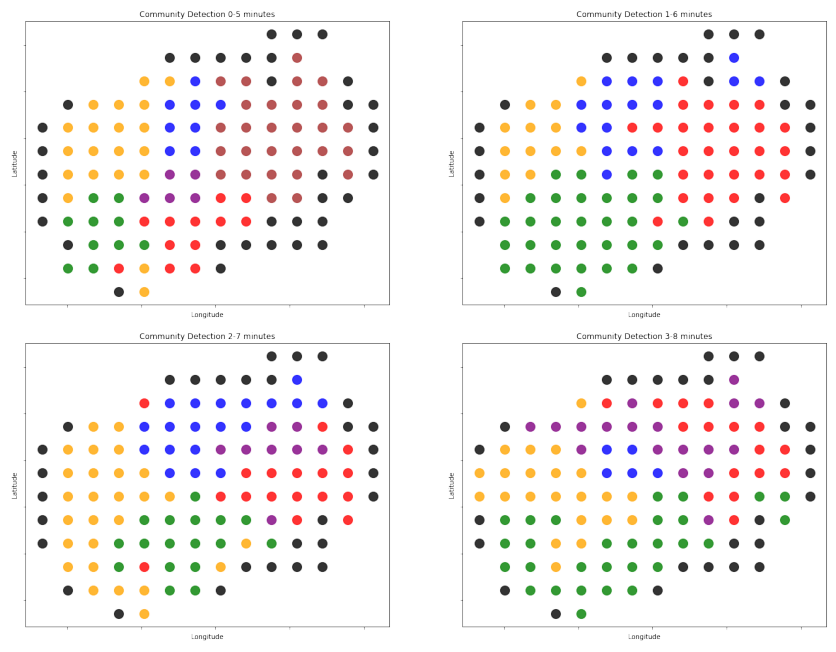
Figure 5: Community detection for 5 minutes rolling windows, showing variations in field zone connectivity.
Conclusion
The framework advances the field of sports analytics by transitioning from an individual-centric to a team-centric data analysis model, effectively providing a mechanism to uncover complex game dynamics from spatio-temporal datasets. Future work can extend this by incorporating advanced graph-theoretical methodologies and expanding to other sports, thereby generalizing the utility of TWGs across diverse athletic domains. The study paves the way for enhanced strategic insights, benefitting stakeholders such as coaches and sports scientists engaged in performance optimization.