- The paper introduces Metron, a framework that employs a new fluidity-index to track token generation deadlines in LLM inference systems.
- The evaluation reveals that traditional metrics like TTFT and TPOT mask latency spikes, while fluid token rate analysis provides clearer performance insights.
- Metron's holistic approach enables defining operator-driven SLOs and benchmarking both proprietary and open-source systems under varying loads.
Introduction
The paper presents "Metron," a framework for evaluating LLM inference systems by addressing the limitations of current performance metrics. It focuses on enhancing real-time user experience metrics for LLMs used in applications like chat and translation. Standard metrics such as Time To First Token (TTFT), Time Between Tokens (TBT), and normalized latency often fail to capture the complex, temporal dynamics of LLM systems. Instead, Metron introduces a new metric called the "fluidity-index," which aims to assess the real-life performance of LLMs more accurately.
Motivation and Shortcomings of Existing Metrics
Current metrics are inadequate for evaluating LLM inference systems effectively. TTFT, which measures the prompt processing efficiency, fails to account for the quadratic increase in latency with prompt length, which makes it impractical for fixed SLOs for TTFT especially with long prompts.
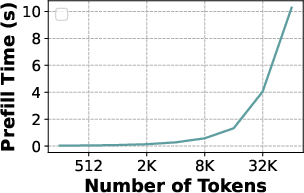
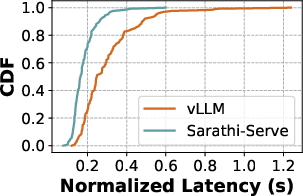
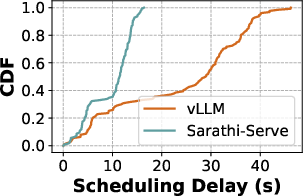
Figure 1: Increase in prefill latency with prompt length (Yi-34B on 2-H100) makes it infeasible to operate with fixed TTFT SLOs, especially for models with long context support.
Additionally, metrics such as TPOT and normalized latency can mask the irregularities in token generation due to their normalization process. For instance, tail latencies often give a misleading estimation of token throughput because of their tendency to ignore the distribution and magnitude of stalls.
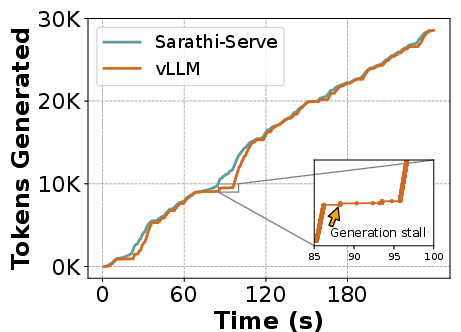
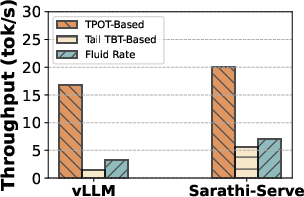
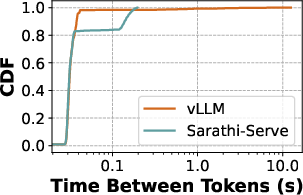
Figure 2: (a) Decode tokens can be intermittently stalled due to prefills from incoming requests. (b) Naively normalizing total decode latency in TPOT, hides these latency spikes and overestimates the system token throughput. (c) Simply observing tail latency does not capture the nuances in the latency distribution. P85 latency for Sarathi-Serve is higher compared to vLLM while it has much lower P99 latency. Performance evaluations with fluid token generation rate accounts for all these variations and provides an accurate and balanced view of system performance. Here for fluid token generation rate, we enforce that 99\% of the requests meet deadlines at least 90\% of the time (fluidity-index > 0.9).
Metron: Design and Implementation
Metron addresses these issues by introducing the fluidity-index metric, which evaluates token generation against a timeline of expected deadlines rather than average token speed. This approach draws an analogy between LLM token generation and video frame rendering in real-time systems. If tokens are generated a few ahead of schedule, any latency can be buffered, reducing the perceived delay to the user.
The key is aligning each token with an expected generation time—a deadline—considering both decode and prefill stages. A defined scheduling slack aids in adjusting for system load or unexpected delays, refining deadline accuracy. Fluidity-index measures how closely a system meets deadlines, providing a metric reflecting real-time user experience.
Evaluation
The authors conducted extensive performance evaluations using Metron on both open-source and proprietary LLM systems. For example, public APIs like Anyscale, Groq, and Fireworks were analyzed using Metron's black-box evaluation to gauge their performance under various configurations.
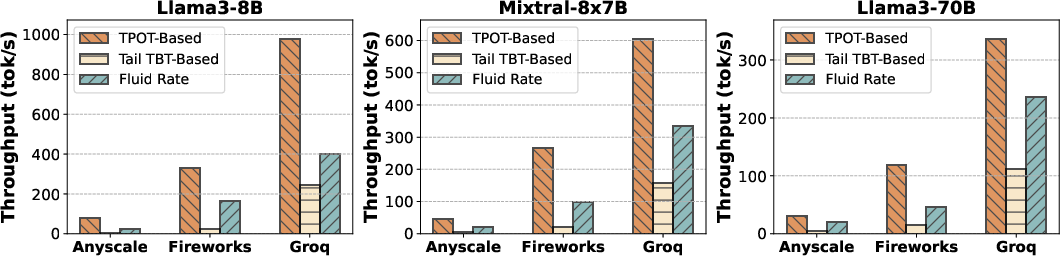
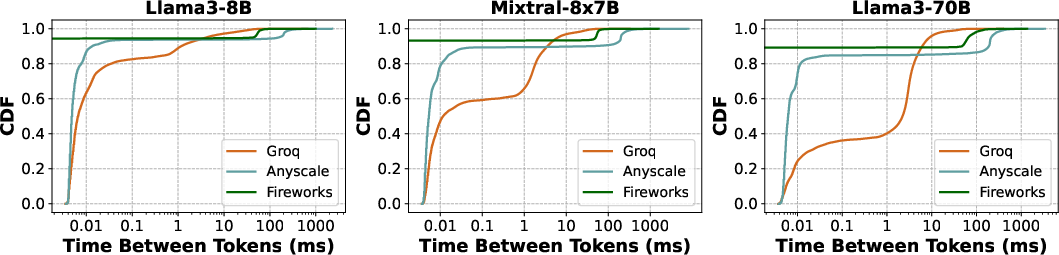
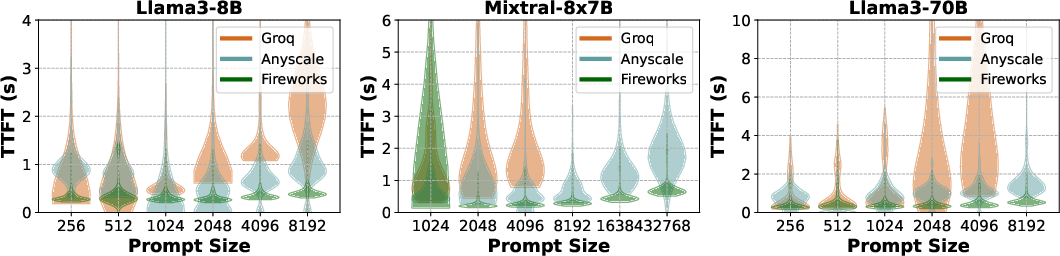
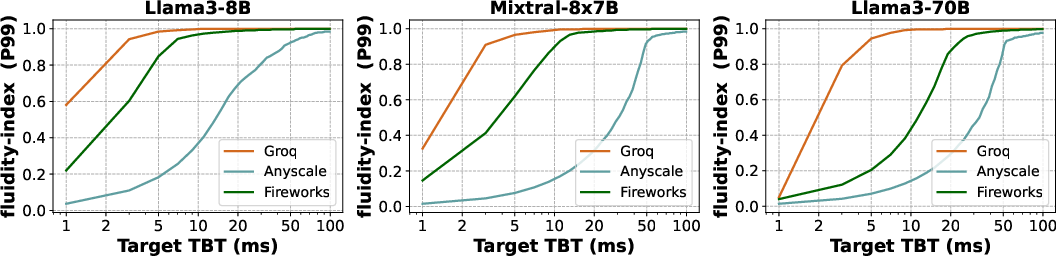
Figure 3: Evaluation of proprietary serving offerings for Mixtral-8x7B and Llama3-70B performed over duration of 24 hrs. (a) shows the token throughput as estimated by different decode latency metrics, (b) presents the overall decode latency distribution across all requests, (c) shows the TTFT for different prompt lengths and (d) provides a full characterization of the system by showing the fluidity-index as a function of target TBT.
Open-source systems, specifically vLLM and Sarathi-Serve, were evaluated using Metron to define operator-driven Service Level Objectives (SLOs) for deployment scenarios, demonstrating Metron's ability to identify the maximum capacity each system could sustain under specific service quality requirements.
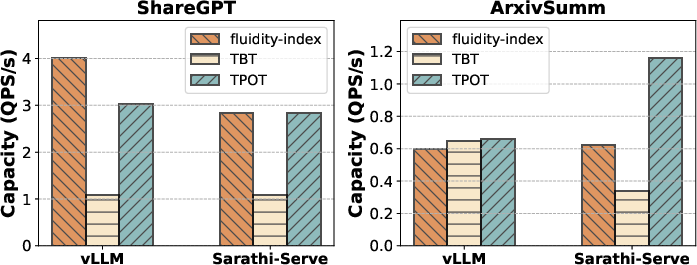
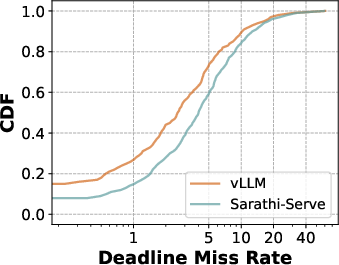
Figure 4: Capacity evaluation of open source systems vLLM and Sarathi-Serve performed on H100 for Llama3-8B. (a) shows the overall capacity achieved obtained by using different decode lat. metrics - TBT, TPOT, and fluidity-index. (b) captures the distribution of deadline miss rate at capacity point for the two systems.
Conclusion
Metron emerges as a comprehensive LLM evaluation framework, offering detailed insights into LLM inference performance from a user-centric perspective. By introducing the fluidity-index, Metron bridges the gap between traditional metrics and real-world application demands, ensuring a holistic view of system efficiency. The work represents a step towards standardized evaluation for LLM inference systems, enabling developers and researchers to align model performance with user experience. The open-source availability of Metron further supports its utilization and potential integration as a standard evaluation tool across the LLM field.

