ChartFormer: A Large Vision Language Model for Converting Chart Images into Tactile Accessible SVGs
Abstract: Visualizations, such as charts, are crucial for interpreting complex data. However, they are often provided as raster images, which are not compatible with assistive technologies for people with blindness and visual impairments, such as embossed papers or tactile displays. At the same time, creating accessible vector graphics requires a skilled sighted person and is time-intensive. In this work, we leverage advancements in the field of chart analysis to generate tactile charts in an end-to-end manner. Our three key contributions are as follows: (1) introducing the ChartFormer model trained to convert raster chart images into tactile-accessible SVGs, (2) training this model on the Chart2Tactile dataset, a synthetic chart dataset we created following accessibility standards, and (3) evaluating the effectiveness of our SVGs through a pilot user study with an refreshable two-dimensional tactile display. Our work is publicly available at https://github.com/nsothman/ChartFormer .

Paper Prompts
Sign up for free to create and run prompts on this paper using GPT-5.
Top Community Prompts
Explain it Like I'm 14
What is this paper about?
This paper introduces ChartFormer, an AI system that turns pictures of charts (like line graphs and bar charts) into special digital drawings called SVGs that people who are blind or have low vision can touch and explore using tactile devices. The goal is to make charts easier to understand without needing a sighted expert to redraw them.
What questions does the paper try to answer?
To make charts more accessible, the authors focus on three main goals:
- Can an AI look at a chart image and automatically create a touch-friendly version in SVG?
- Can we train this AI using a dataset built with accessibility rules in mind?
- Do people who are blind find these AI-made SVG charts useful on tactile displays?
How did the researchers do it?
They built a system called ChartFormer based on a “vision-LLM.” Think of it like a smart assistant that can both look at pictures and describe or recreate them in words or code.
Here’s the approach, explained simply:
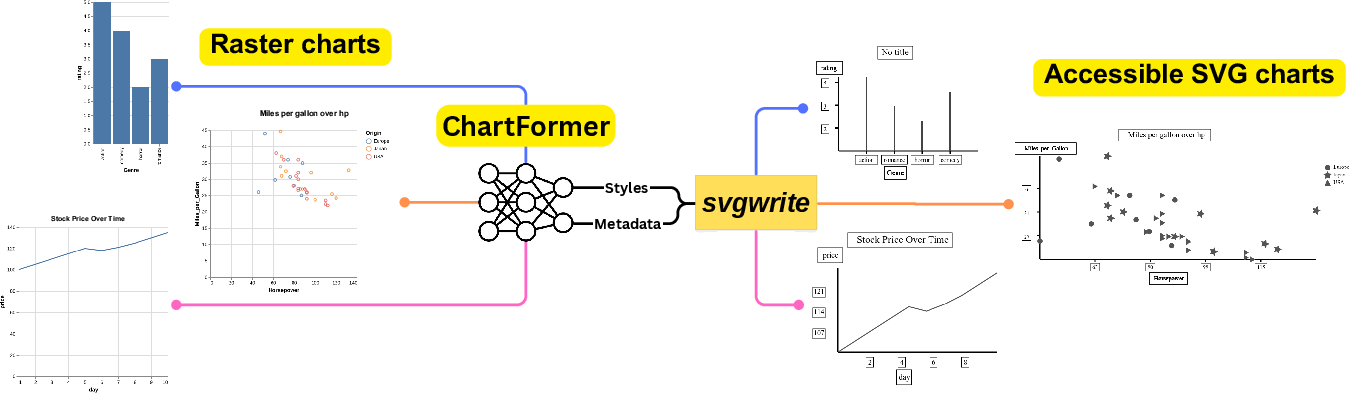
- Chart images: The input is a regular chart image (a “raster,” which is a picture made of tiny dots).
- SVG output: The system creates an SVG (Scalable Vector Graphics), which is like a digital drawing made of lines and shapes. SVGs can be resized without getting blurry and can include text descriptions and styles—perfect for tactile displays and screen readers.
- Training data: They created a new dataset called Chart2Tactile with 10,000 charts (line, bar, scatter, and error-bar). These charts were built to follow accessibility rules, such as using thicker lines, clear patterns (like dashed or dotted), and Braille labels.
- Accessibility rules: For tactile charts, they followed guidelines like:
- Make lines and shapes easy to feel by using different thicknesses or patterns.
- Avoid thin lines that are hard to detect by touch.
- Use Braille for text and keep it horizontal.
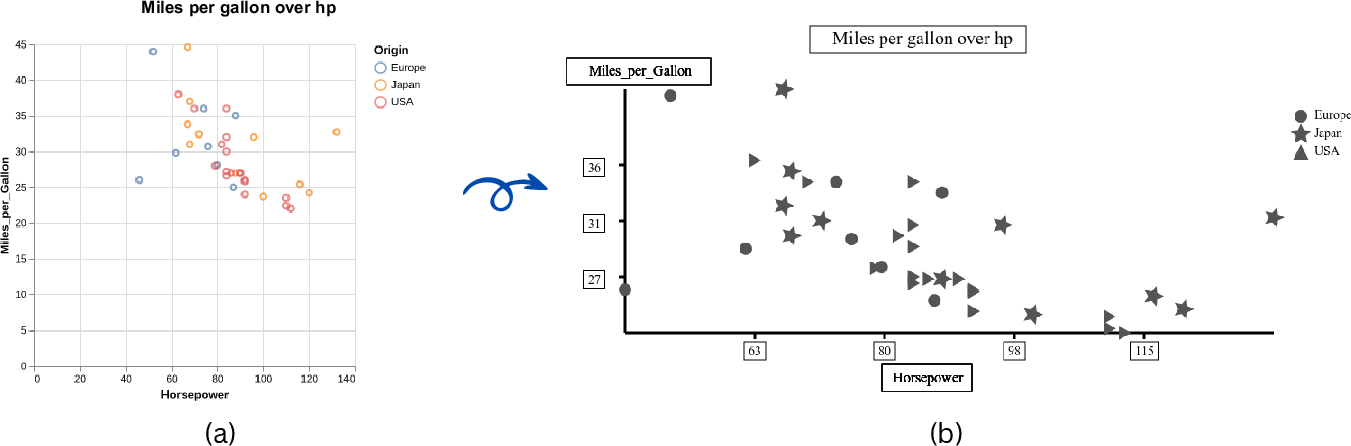
- For crowded charts (like scatter plots), only include important points to avoid clutter.
- Put text in boxes to make it easier to find by touch.
- AI training: They fine-tuned an existing model (LLaVA-1.5, a popular vision-LLM) so it could:
- Identify the chart type (line, bar, scatter, etc.).
- Read titles and labels.
- Figure out axis ranges and label types (like numbers, dates, or text).
- Extract the data needed to draw the chart in an accessible way.
- Rendering: Using code templates, the AI fills in the necessary info and styles to produce the tactile-ready SVG.
What did they find, and why does it matter?
The authors ran a small user study with four blind participants using a 2D tactile display. Here’s what happened:
- For simpler charts (one or two lines), participants could identify lines, intersections, and trends (increasing, decreasing, or flat) without trouble.
- For a very busy chart (six lines), it was harder to count all intersections, mostly because there was a lot happening in the same space.
- Zoom and audio descriptions helped: Some participants used zoom on the tactile device to feel fine details, and they liked having audio descriptions for text labels and titles.
- Suggested improvement: Participants asked for smoother lines to avoid a “stair-step” feel (jagged edges on the tactile display).
This matters because it shows AI can help make charts accessible—quickly and consistently—without needing a trained designer for every chart. It could make school materials, reports, and scientific papers more usable for people who are blind or have low vision.
What does this mean for the future?
This work is a first step toward automatic, touch-friendly charts:
- It could save time for teachers, students, and professionals who need accessible visuals.
- The dataset and code are public, so others can build on this.
- There’s room to grow: The system currently focuses on x–y charts and tested line charts in the user study. Future work could support more chart types, add a simple editing interface for fine-tuning results, and include larger user studies.
- Big picture: AI models that can “see” and “talk” (like ChartFormer) could be adapted to help many different groups, making digital information more inclusive across education and workplaces.
Glossary
- Accessibility guidelines: Standards and best practices that ensure visualizations are usable by people with visual impairments. "We have also introduced the first dataset for tactile visualizations that complies with accessibility guidelines."
- Accessibility standards: Formal criteria that define how content should be made accessible. "the Chart2Tactile dataset, a synthetic chart dataset we created following accessibility standards"
- Assistive technologies: Tools that help people with disabilities access content. "assistive technologies for people with blindness and visual impairments, such as embossed papers or tactile displays."
- Audio descriptions: Spoken or textual narrations that describe visual elements for non-visual access. "They also appreciated the audio descriptions, which facilitated access to the chart's textual elements."
- Baseline weights: Pretrained parameters used to initialize a model before further training. "We used the baseline weights from ChartLLama"
- Braille: A tactile writing system used by people who are blind or visually impaired. "Text in tactile illustrations should be in Braille, oriented horizontally."
- Bounding box: A rectangular region that encloses content to aid separation and exploration. "Enclose text content with a bounding box for better exploration and distinguishing separate texts more effectively."
- Chart analysis: Automated understanding and processing of chart images and structures. "we leverage advancements in the field of chart analysis to generate tactile charts in an end-to-end manner."
- Chart summarization: Generating concise textual descriptions of charts’ key information. "have focused on making visualizations accessible through chart summarization tasks"
- CSV: A plain-text format for tabular data where values are separated by commas. "with each chart including four modalities: image, CSV, Python code, and text description."
- Embossed papers: Raised-print materials that convey tactile information for non-visual reading. "such as embossed papers or tactile displays."
- End-to-end: A system that performs the entire task from input to final output without manual intermediate steps. "generate tactile charts in an end-to-end manner."
- Error-bar charts: Charts that include error bars to represent variability or uncertainty in data. "spanning 4 categories (line, bar, scatter and error-bar charts)"
- Fine-tuned: Further trained a pretrained model on a specific dataset or task. "and then fine-tuned the model for 10 epochs using our dataset."
- GUI: A graphical user interface that enables interaction through visual elements. "a GUI that comprises six steps to convert bitmap images into printable SVG format."
- Hyperparameters: Training settings controlling model behavior (e.g., learning rate, epochs). "adopted the same hyperparameters for training"
- Matplotlib: A Python library for creating static, animated, and interactive visualizations. "converting charts into Matplotlib Python codes."
- Metadata extraction: Parsing and retrieving structured information from chart images. "beginning with metadata extraction and followed by conversion into tactile format."
- Modality: A mode or form of data representation or interaction (e.g., visual, tactile, textual). "but none have considered the tactile modality."
- Raster images: Pixel-based images that can blur when scaled. "they are often provided as raster images"
- Refreshable two-dimensional tactile display: A device that dynamically renders tactile graphics for non-visual exploration. "a pilot user study with an refreshable two-dimensional tactile display."
- Scalable Vector Graphics (SVG): A resolution-independent vector image format based on XML. "saved in the Scalable Vector Graphics (SVG) format."
- Screen readers: Software that converts text and interface elements into speech or Braille output. "enhances interactivity when used with screen readers or tactile displays."
- Staircasing effect: A jagged appearance in tactile or low-resolution renderings of lines. "staircasing effect in the tactile output."
- svgwrite: A Python library for programmatically generating SVG files. "we used the svgwrite Python package"
- Time-series data: Sequential data points indexed by time. "each accompanied by time series data and a raster version."
- Transformer-based model: A neural architecture leveraging attention mechanisms for sequence processing. "We introduce a transformer-based model that extracts key information and assigns styles for the SVG file."
- Vega-Lite: A high-level grammar of interactive graphics for declarative visualization. "rendered a raster image using Vega-Lite"
- Vision encoder: The component of a multimodal model that processes visual inputs. "comprising a vision encoder for image input and a LLM for text output decoding."
- Vision-LLM (VLM): A multimodal model that jointly processes visual and textual data. "trained a large Vision-LLM (VLM) on synthetically generated images across 10 chart types."
- x-y plot: A chart plotting data points with values along horizontal (x) and vertical (y) axes. "The ChartFormer takes a raster x-y plot as an input."
- XML-based: Structured using the Extensible Markup Language format. "SVGs are XML-based files that store geometrical shapes using mathematical formulas in a hierarchical structure."
Collections
Sign up for free to add this paper to one or more collections.

